
The charts below reflect data derived from the Attorney General’s report, reflecting all allegations whether or not they were substantiated.
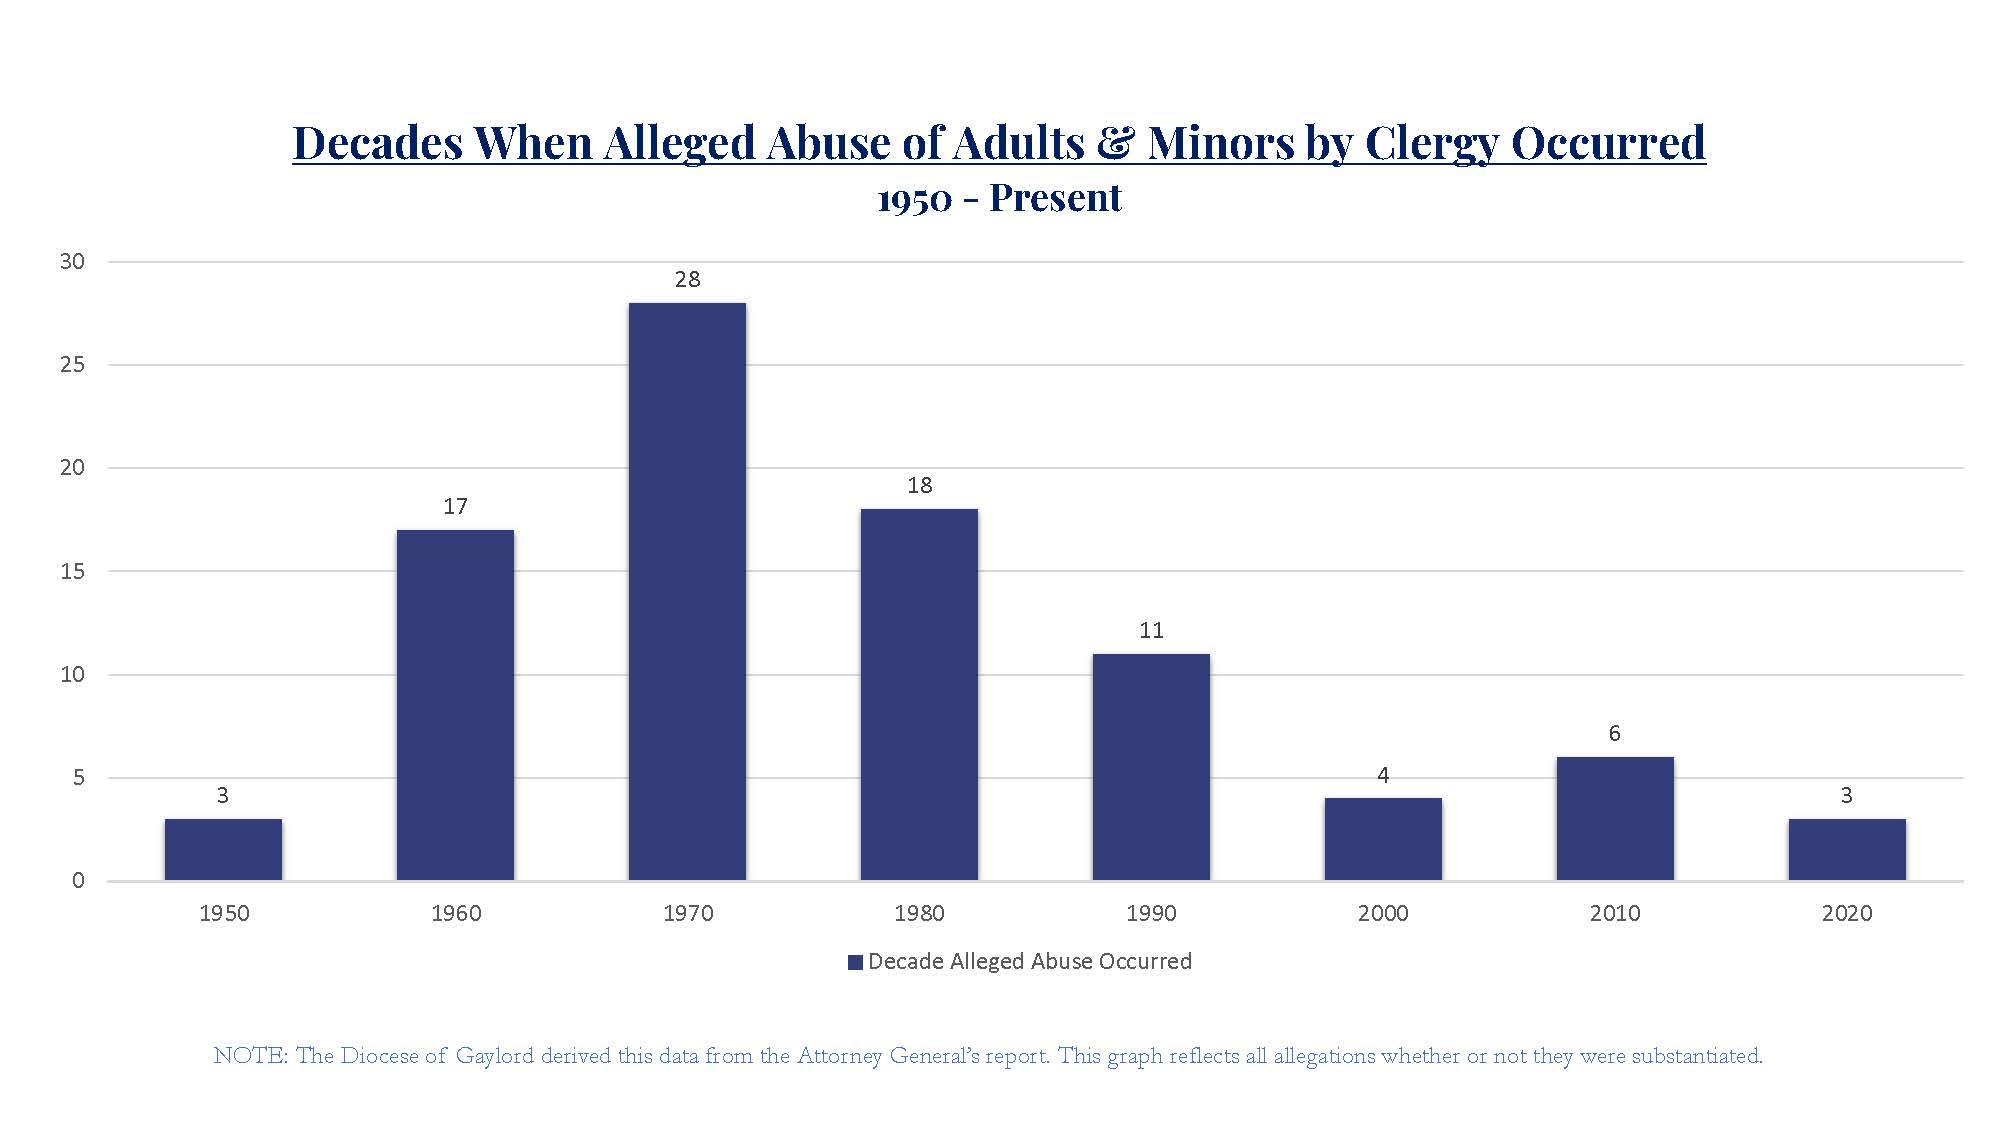
The above graph shows approximately 85% of the alleged incidents of sexual abuse occurred prior to 2000.
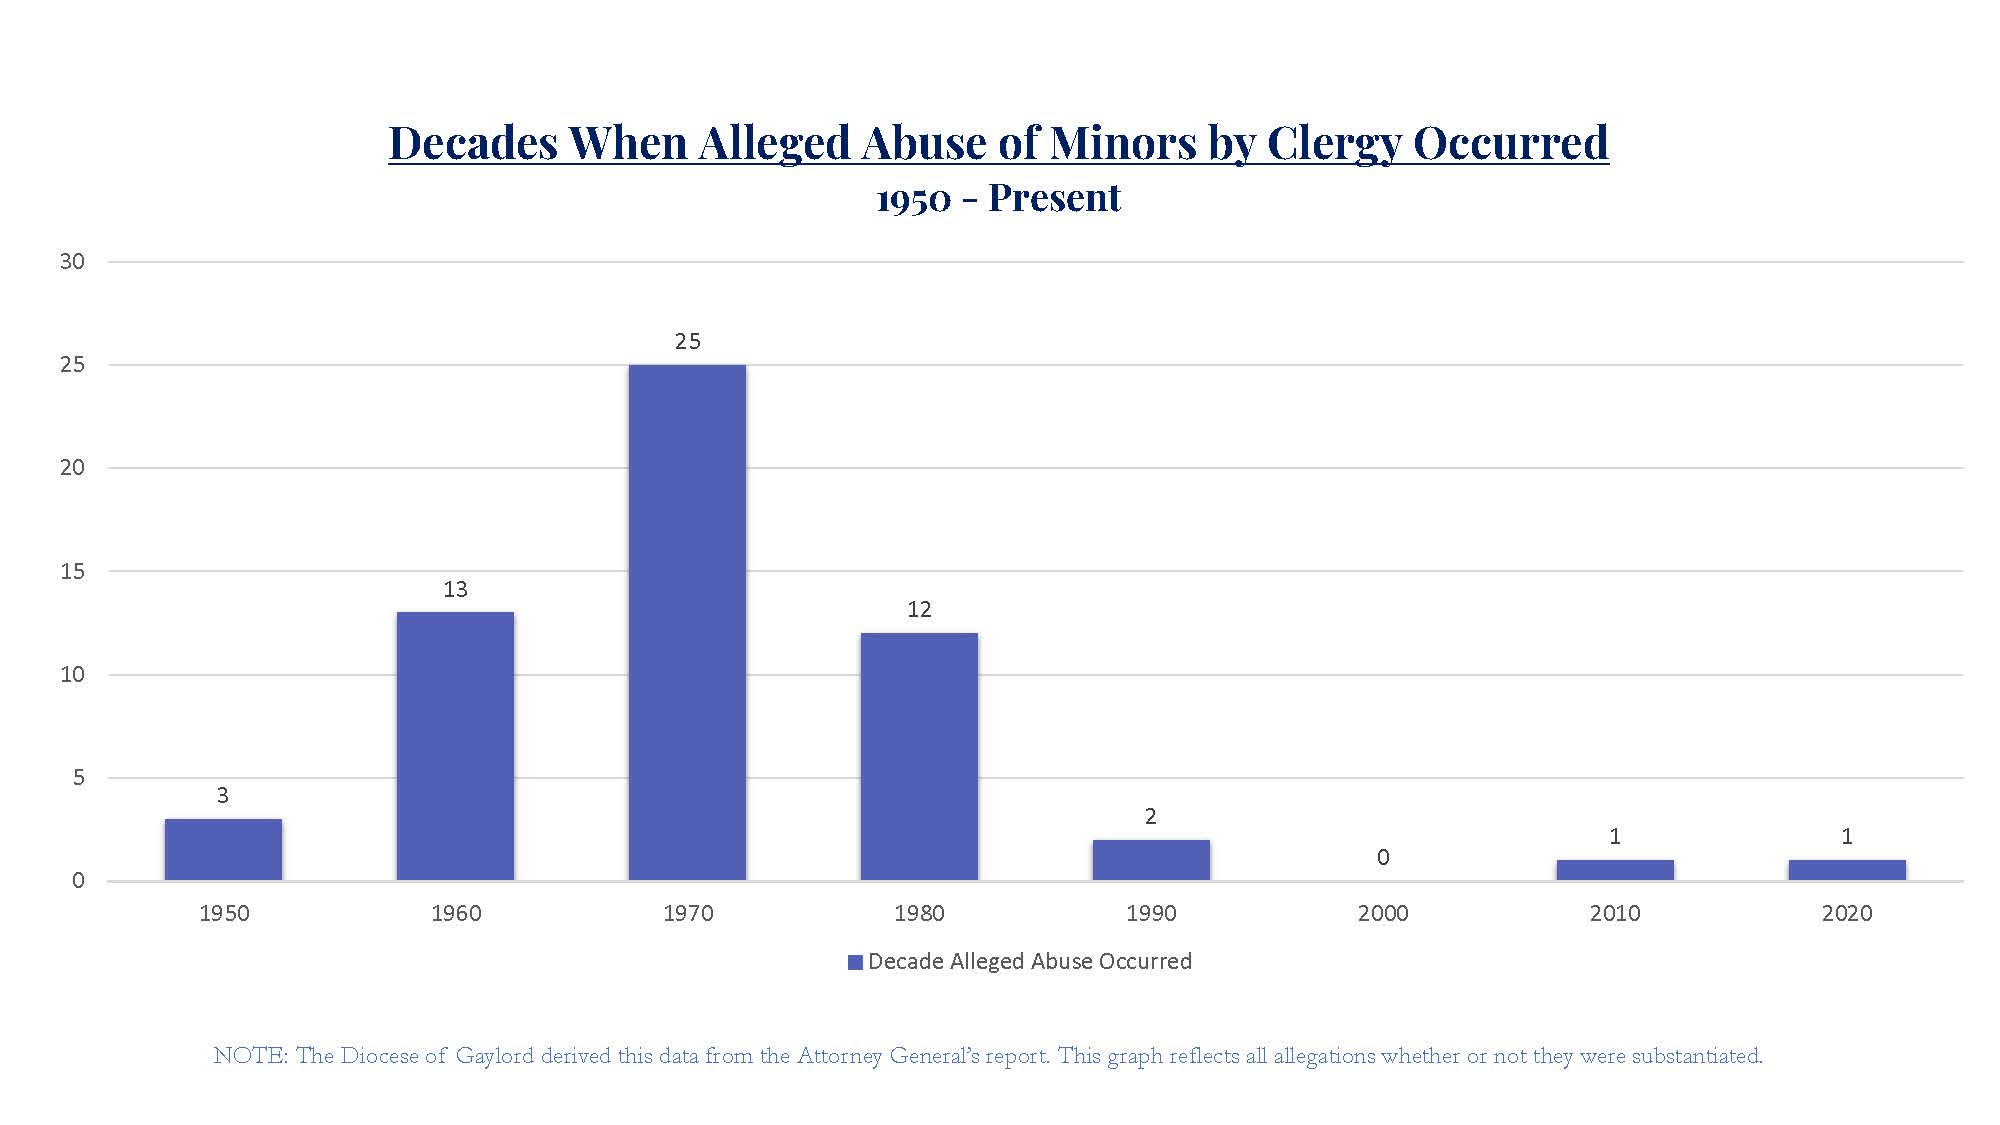
The above graph shows nearly all of the reported sexual abuse allegations involving minors occurred before 2000. The two instances that were reported since 2000 were inappropriate conduct cases by a priest who is no longer in ministry.
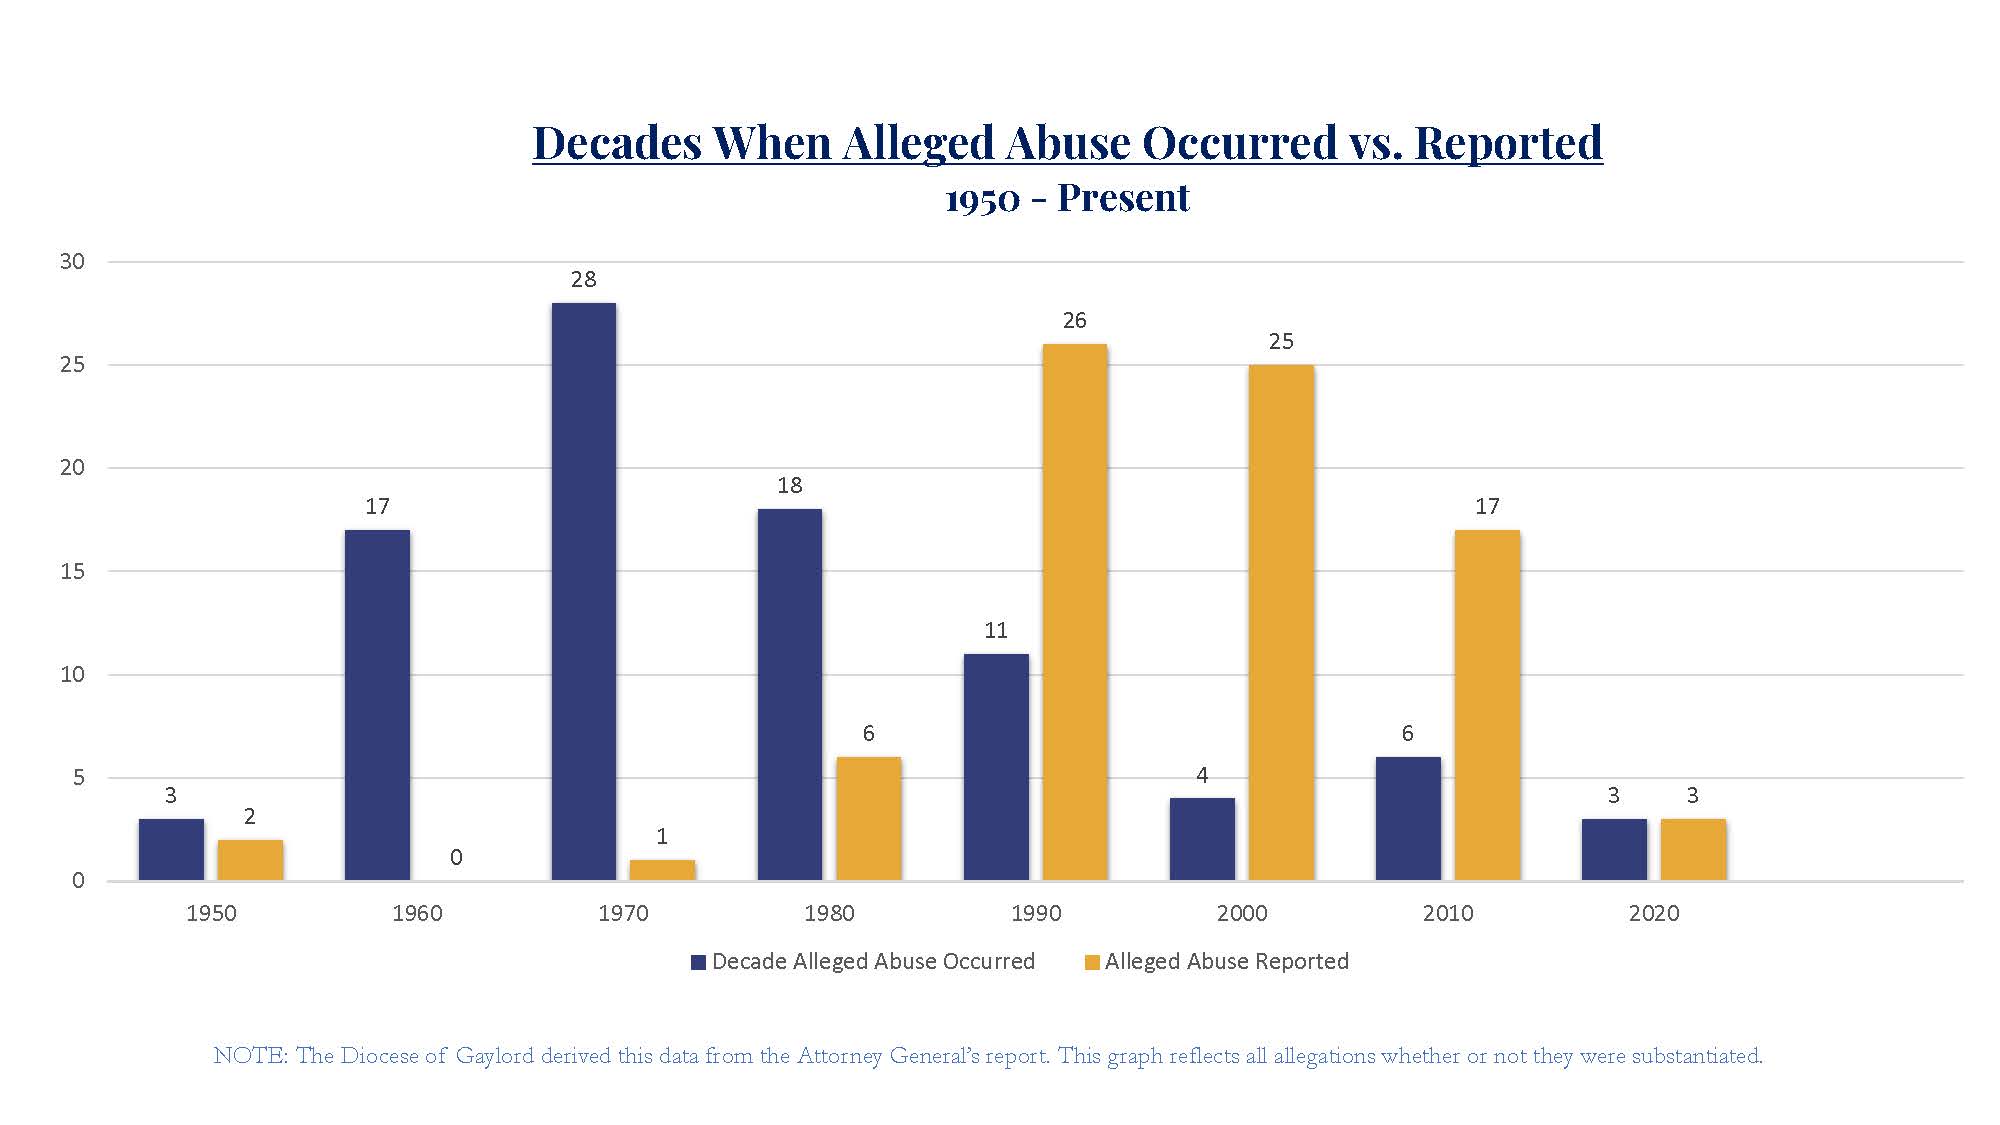
The above graph shows the decade of when alleged abuse occurred compared to the decade the alleged abuse was reported.
When comparing the timeframes, one can see that many individuals reported to the diocese or law enforcement years or decades after the incident.